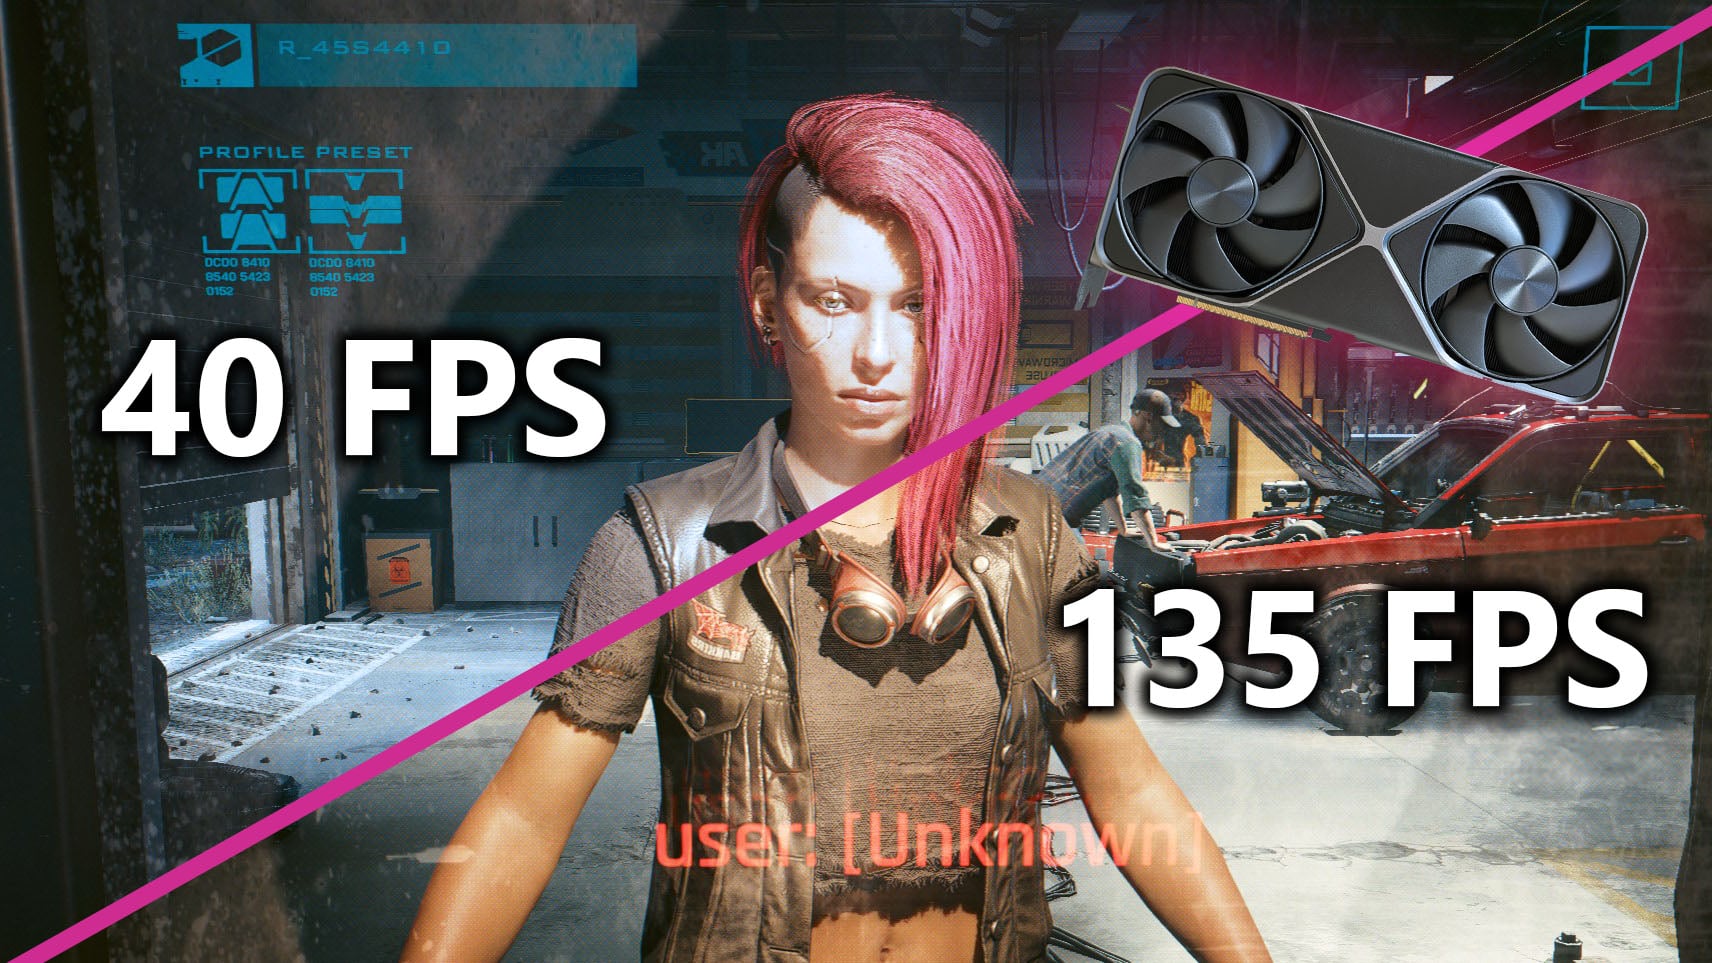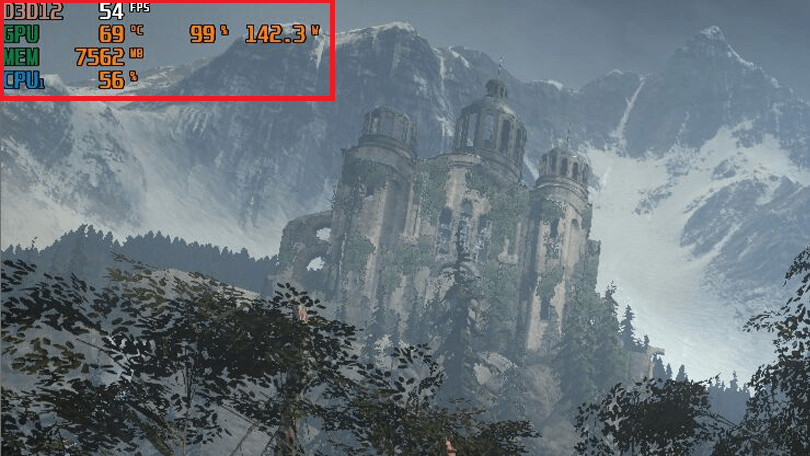
Three reviews of the same graphics card, in the same game, at the same resolution. One says 94 fps, one says 112, one says 78. Nobody is lying, nobody made a mistake, and the numbers cannot be reconciled — because they are not measurements of the same thing.
The card is a constant. Almost nothing else in those three tests was.
There is no standard scene
Start with the largest source of the spread, because it dwarfs everything else and it is invisible in the published result.
A game is not a benchmark. It is hours of wildly varying load, and a reviewer has to pick sixty seconds of it. One picks the opening of a town because it is CPU-heavy and reproducible. Another picks an outdoor traverse because it stresses streaming. A third uses the built-in benchmark because it is the only thing that runs identically twice.
Those three sixty-second slices of one game can differ by thirty per cent or more from each other on identical hardware. And the review will describe all three the same way: the game's name, the resolution, the preset.
So the first thing to internalise is that the game name in a chart is not the test. The scene is the test, and it is usually described in a sentence of prose above the chart, if at all.
What else moved
Six more differences sit underneath, each smaller than the scene and none of them negligible.
Settings that share a name
Two reviewers both say "ultra". One left motion blur on, one turned it off. One left the upscaler at its default — which in a growing number of titles is on out of the box — and one disabled it. Ray tracing has three or four sub-settings that presets set differently between patches. "Ultra" is a label the game applies, and it is not a specification.
The driver
Reviews are published weeks apart, and a driver release can move a specific title by several per cent, occasionally much more when a game is newly optimised. A chart is a photograph of a moment in the software's life.
The rest of the machine
A card tested behind a top-tier processor with fast memory produces higher numbers than the same card behind a mid-range platform, and the gap widens as the resolution falls. Outlets standardise on a test bench and then keep it for a year or two, so two outlets are frequently comparing cards through different bottlenecks.
The thermal state
A card benchmarked from cold behaves differently from one on its twentieth consecutive run. Modern cards boost hard until they warm up and then settle. A reviewer who runs three passes and takes the best is measuring a different thing from one who runs a twenty-minute soak and reports the plateau.
The patch
Games change. A title that has had two performance patches since a review was published is not the game in that chart, and the review does not update itself.
What "1% low" meant to whoever wrote it
Some outlets report the average of the slowest one per cent of frames. Some report the frame rate at the 99th percentile frametime. Some report a rolling minimum. These give different numbers from the same capture, and the label on the bar is the same in every case.
Adding it up
Put plausible spreads on each of those and see what an honest disagreement looks like. Take the scene at ±15 per cent, settings interpretation at ±10, the driver at ±5, the test platform at ±8, and run-to-run variation at ±3.
These are independent sources, so they combine as the square root of the sum of their squares rather than by simple addition:
√(15² + 10² + 5² + 8² + 3²) ≈ 21 per cent
Two competent, careful, entirely honest reviews of the same card in the same game can therefore differ by something like a fifth, with no error anywhere. The 94 and the 112 at the top of this article are 19 per cent apart. They are not in conflict. They are inside the noise floor of the whole enterprise.
That number is worth carrying because it sets your expectations correctly. If you find two reviews 5 per cent apart, they agree. If you find two reviews 40 per cent apart, something specific is different and it is worth finding out what.
Why the built-in benchmark does not rescue this
The obvious fix is for everyone to use the game's own benchmark, and some outlets do. It does make results reproducible between runs and between outlets, which is real.
What it does not do is make them representative. A built-in benchmark is a scripted flythrough chosen by the developer to be stable and repeatable, which usually means avoiding exactly the things that cause trouble: heavy streaming, dense crowds, physics events, traversal across a boundary. It is a clean lap of an empty track.
So the trade is explicit. The built-in benchmark gives you a number two outlets can compare and that does not describe playing the game. A hand-run scene describes playing the game and cannot be compared between outlets. There is no third option, and any outlet that has thought about it has picked one and told you which.
The two cards were not the same card
There is one source of disagreement that is not methodology at all, and it catches even careful readers: the model name on the chart does not identify the product.
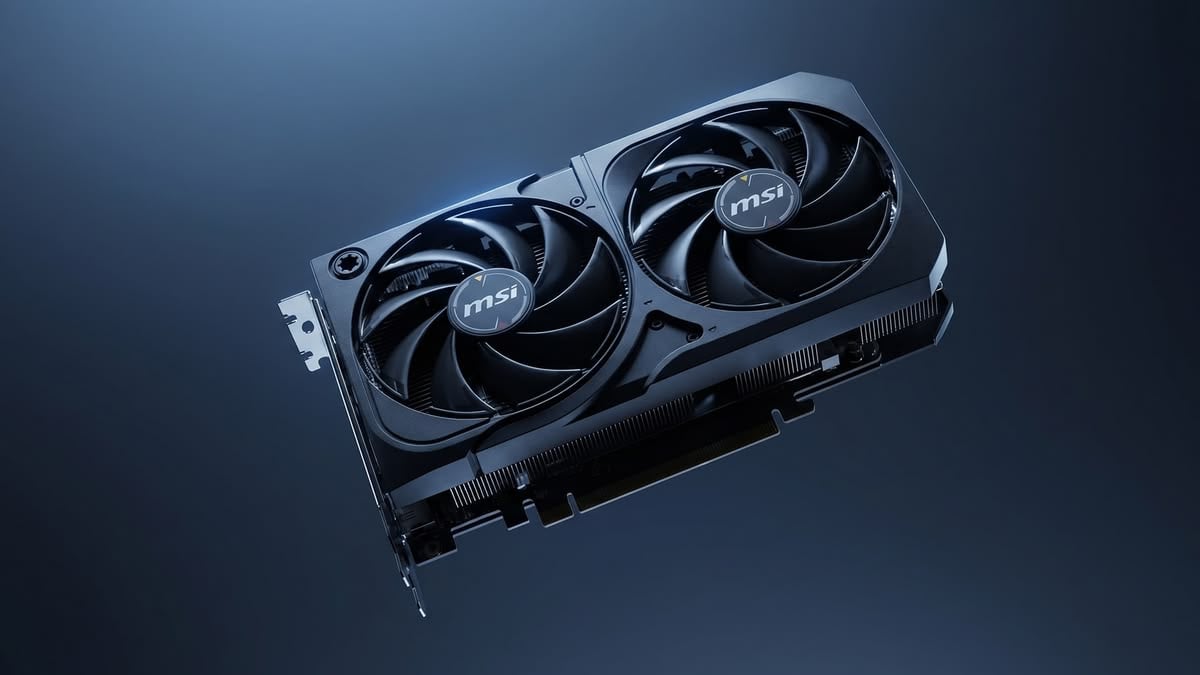
A graphics card model ships as a reference design and then as a dozen partner variants, and those variants do not behave identically. They arrive with different power limits — a factory-overclocked model may be permitted twenty per cent more board power than the reference — different cooler quality, and therefore different sustained clocks once they warm up. Five to eight per cent between two units badged with the same model name is ordinary.
Processors have a quieter version of the same problem. Two samples of one part do not clock identically, and reviewers work with whatever they were sent. An outlet that received a good sample and one that received an average sample will publish results that differ for reasons no methodology paragraph will ever explain, because neither reviewer knows.
So before concluding that two outlets disagree, check that they tested the same object. A reference card against a heavily factory-overclocked one is not a contradiction — it is two accurate measurements of two different products.
How much does the reviewer trust their own number?
The best outlets answer this explicitly and it is the fastest way to judge one.
A single run is not a measurement. Run the same scene three times on the same machine and the results scatter by a couple of per cent from thermal state, background processes and the game's own non-determinism. An outlet that runs a scene once and publishes the number has an unquantified error bar; one that runs it three or five times and reports the spread has told you how much of the difference between two bars is real.
This is why a two-per-cent gap in a chart usually means nothing at all, and why the outlets who take it seriously will say in print that they do not consider differences below some threshold meaningful. When a review declines to declare a winner between two cards three per cent apart, that is not fence-sitting. It is the only honest reading of their own data.
A ladder for when two reviews disagree
- Were they the same variant? Reference versus factory-overclocked accounts for a large share of apparent contradictions.
- How far apart were the publication dates? A driver or a game patch in between explains a great deal.
- What scene? If one used the built-in benchmark and the other ran the game, expect a large gap and trust the second for how it plays.
- Was upscaling on by default? Increasingly it is, and an outlet that left the defaults alone measured something different from one that turned everything off.
- What was behind the card? At 1080p especially, the test platform is part of the result.
What actually survives all this
The situation is not hopeless — it is just that the durable information is not the absolute number.
- The ordering within one chart. Every card in that chart met the same scene, the same settings, the same driver and the same bench on the same day. The gaps between the bars are real even though the heights are not portable.
- The relative delta. "This card is 18 per cent ahead of that one" survives translation between outlets far better than "this card does 112 fps" ever will.
- The shape across resolutions. A card that leads at 1080p and loses at 4K is telling you something about itself that no single number does.
- The 1% lows relative to the averages in the same chart, which is a distribution question and mostly immune to scene choice.
How to read three reviews at once
- Pick one outlet as your ruler. Learn its bench and its habits, and use its absolute numbers as your baseline. Consistency beats correctness here.
- Use the others for the relative deltas only, and expect them to agree with your ruler on ordering while disagreeing on magnitude.
- Read the methodology paragraph. Which scene, which driver, which platform, how many runs. An outlet that does not publish this is asking you to trust a number you cannot interpret.
- Treat a lone outlier as a question, not a result. One review 40 per cent away from three others has found something — a driver bug, a patch, a different scene — and the interesting thing is what.
Two things we would not buy
A card chosen because one review's absolute frame rate cleared a threshold you care about. That number carries roughly a fifth of uncertainty when transplanted to your machine and your scene, which is more than the gap between most adjacent cards in a product stack.
And the card that wins a chart assembled by someone else out of numbers from several outlets. Those aggregate tables circulate constantly and they are the one thing in this subject that is genuinely wrong: they add together measurements that were never comparable, and the ranking they produce is an artefact of whose bench was fastest.
How this was put together
The variance sources here come from the methodology the testing outlets publish about themselves — Hardware Unboxed and TechSpot on scene selection and platform choice, Gamers Nexus on run-to-run deviation and the discipline of re-testing a whole chart when the bench changes, TechPowerUp on per-title runs across a large card range, and Digital Foundry on why a chosen scene rather than a built-in benchmark is what tells you about playing a game. The percentile-definition differences are visible by comparing what each outlet states it computes.
The derived figure is ours: the error budget above, combining the independent spreads in quadrature to about 21 per cent — which is the amount by which two entirely honest reviews of one card can disagree before anything has actually gone wrong.